English


-
CloudCCLogin to your CRM system
-
Industry Mall
No registration required! Instantly access DEMO systems for 30 niche-industry CRMs and experience how AI and big data truly deliver industry know-how!


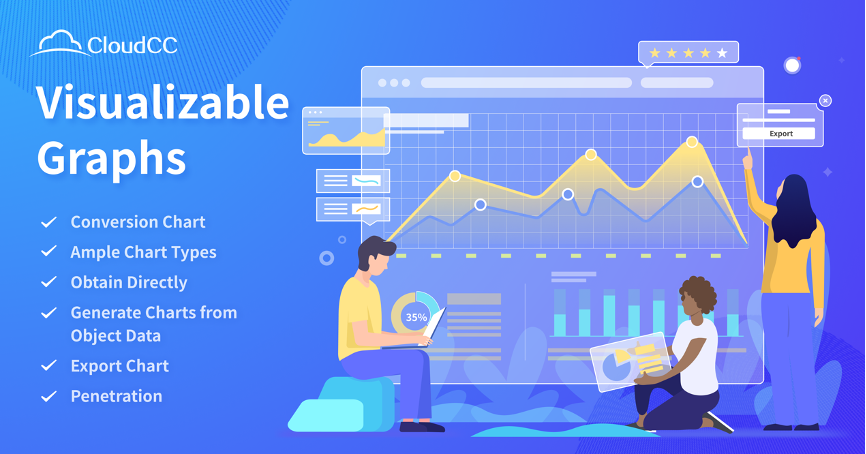
CloudCC CRM Visualizable Graphs
December 02 2023Creating effective business dashboards is crucial for visualizing and understanding the overall status of a business. Dashboards provide a consolidated and interactive view of key performance indicators (KPIs) and metrics.
In CloudCC,Support up to 20 different types of categorized dashboards, and you can choose the right one for your purpose and display your CRM data in a simple and intuitive way.
Conversion Chart
Charts are more intuitive and clearer than reports. You can generate charts from reports with one click to form your business insights.
Ample Chart Types
Various chart types including column, line, funnel, table, donut, pie, area, bar chart, and heat maps to ensure visual presentation of data.
Obtain Directly
When viewing a chart, we need to know the corresponding detailed data. Sales reps can easily learn about the data about customers and orders behind the chart with just one click on the chart.
Generate Charts from Object Data
It is supported to fully customize your charts. You can filter and extract data for each object from leads to orders, generating charts as you wish.
Export Chart
When reporting or presenting, you may often need to take your CRM charts offline for presentation. CloudCC BI supports you to export charts directly or export them as PDF files.
Penetration
Penetration feature allows you to drill through directly to the view and click on the data to see the details.