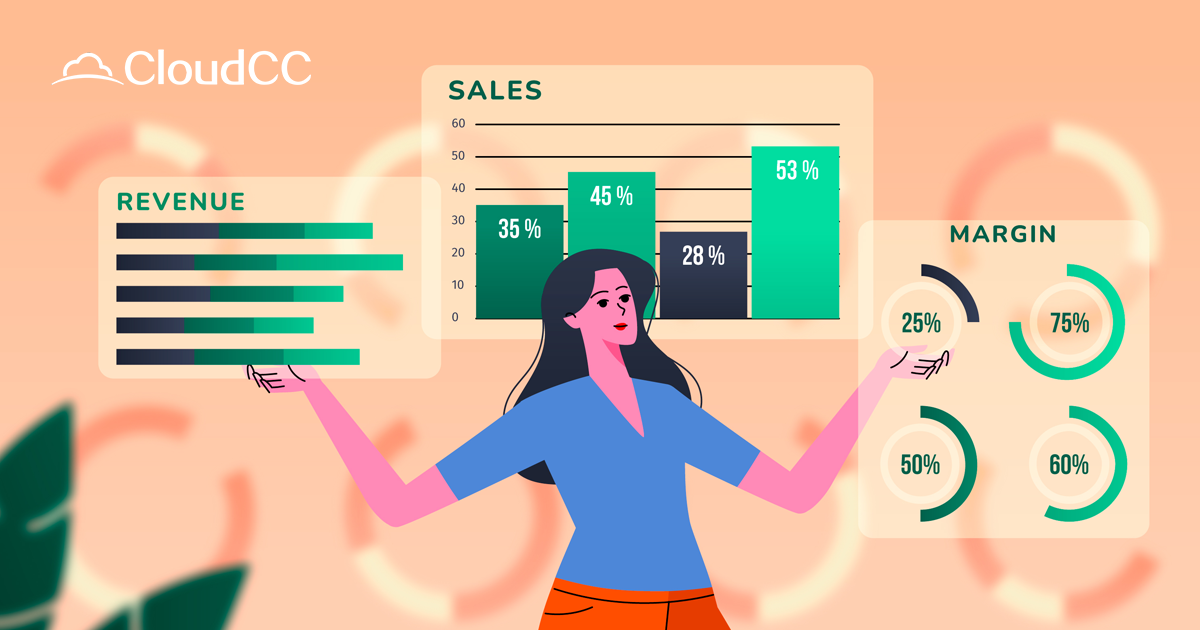
Visually Represent Key Performance Indicator
December 11 2023Visual representation of Key Performance Indicators (KPIs) is essential for quick and easy interpretation of data in CloudCC CRM.Key performance indicators track your performance against key business objectives. Add KPI monitors to your charts to keep track of your key performance measures at a glance and respond timely.
Dashboards
Create customized dashboards that display a visual overview of your most important KPIs. Dashboards in CloudCC allow you to combine charts, graphs, and other visual elements for a comprehensive view
Choose Different KPI Types
Choose style according to various business targets, always focusing on KPI.
View the Fluctuation
Compare the current month with the previous month to visually reflect data growth/decline.
Rank Sales Indicators
Ranking your metrics based on a variety of criteria can help identify the top and bottom performers. For example, the top salesmen with the highest sales in the last month, or the three least performance contributors in the last quarter.
Remember to tailor the visualizations to the specific KPIs that are most relevant to your business goals. CloudCC CRM often provides a range of customization options for visual representations, allowing you to create a visually intuitive and informative dashboard for your team.


